ECE 178 WINTER 2004
DUE: January 16, 2004.
Note: The TAs will go over the MATLAB exercise during the discussion on Friday, Jan 9.
READING: Chapter 2.1-2.3
* You do not need to submit solutions for problems marked with *. Clearly state any assumptions you make in solving the problems.
1. Problem 2.1*
2. Problem 2.2
3. Problem 2.3*
4. Problem 2.4*
5. Problem 2.5
4. Problem 2.6*
5. Problem 2.7
6. MATLAB: Read the section on Brightness Adaptation in Chapter 2. The human visual system is extremely good at adapting to a wide range of brightness values--of the order of 10^10. However, it can not discriminate all these values simultaneously. It adapts to the ambient intensity and given the background brightness, can only discriminate a small range of values. READ section 2.1.
In the following programming assignment, which is actually quite a bit of fun, you will explore one variation of this adaptation. Ideally, I would like you to generate a plot similar to Figure 2.6 (typical Weber ratio plot). However, you are constrained by the experimental set-up available. Instead, we will fix the background intensity and vary continuously (we are, however, limited to a step-size of ONE gray level in the experiment below) the other intensity till you perceive the two-intensity pattern. Implement the following using MATLAB.
1. Create an image of a circular disc of diameter 256 pixels. Fill the image with constant gray level value I=0.
2. Now create an embedded disk, which is 10 pixels from the sides of the larger one, having an intensity level I'=I+dx.
3. Start with dx=0; keep increasing dx till the circular disc just becomes perceivable to you. Let this value be Dx.
4. repeat steps 2 and 3 for this newly generated disc by starting with I=I+DX and generating an inner disc with a new intensity value. Continue this till I=255 (most computer displays do not display more than 256 shades of gray.)
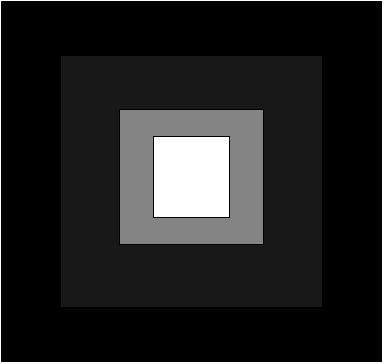
This MATLAB problem is a slight variation of the question that was asked last year--instead of squares, you are generating circles. For the embedded squares, your final image will look similar to the one below (the number of gray levels could be higher or lower, depending on your monitor!). For your assignment, replace the sqaures with concentric circles.
How many different shades of gray you perceive?
You need to present to the TA the following:
(a) a brief report including your final figure.
(b) the MATLAB code you used to run the experiment and generate the figure.
(c) (optional; strongly encouraged) show a demonstration to the TA as to how you carried out the experiment.
NOTE: The figure below uses square regions instead of circular ones. You will be generating concentric circular discs for this assignment.