Directions
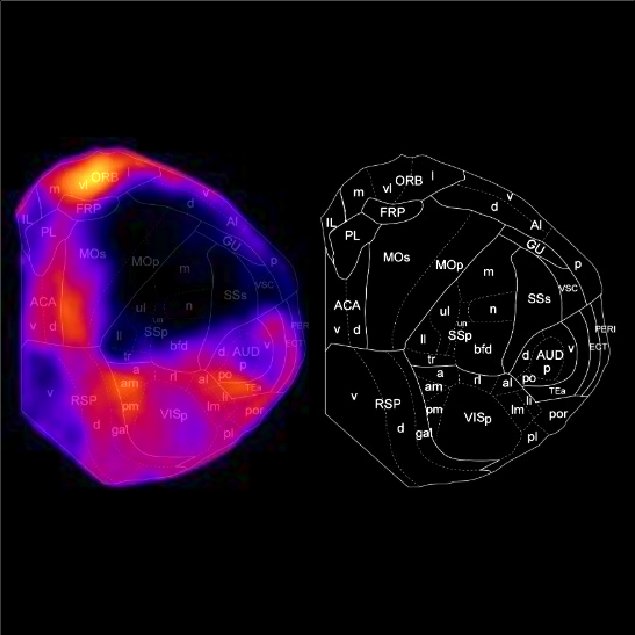
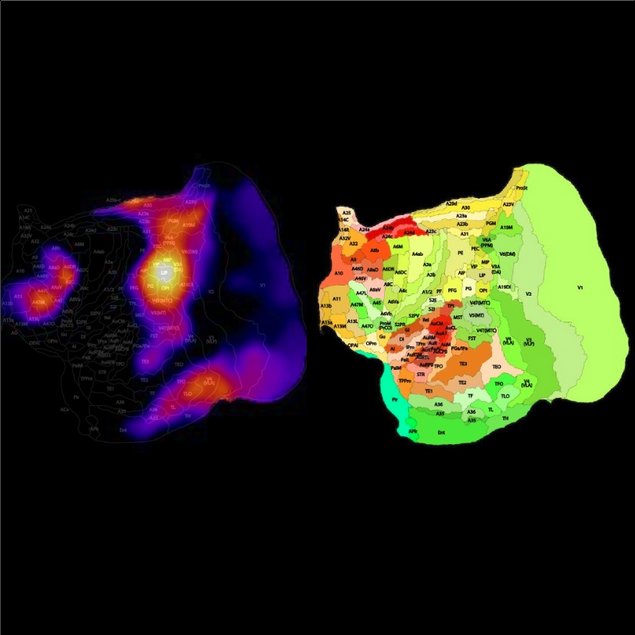
You can manipulate a seed position by moving the cursor of the computer mouse on the screen. Positions in the brain that have a high correlation with the seed position will be highlighted. By locating a computer cursor at your brain region of interest, you can find the areas that receive similar connectivity pattern to the region. As an example, the following figure shows the brain areas where the corticocortical input connectivity pattern resembles that of the orbitofrontal cortex.
You may need to zoom the web browser depending on your screen size to clearly visualize the map.
Modes
Here you can find four types of visualization, Surface,
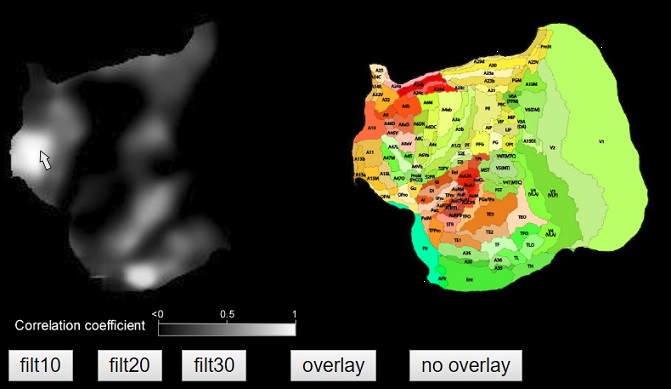
Flat,
Coronal and Sagittal modes.
The Surface mode is limited to the areas which can be viewed from the outside. This mode is the best for visualizing the connection patterns between the cerebral cortex since the cerebral cortex has a columnar organization.
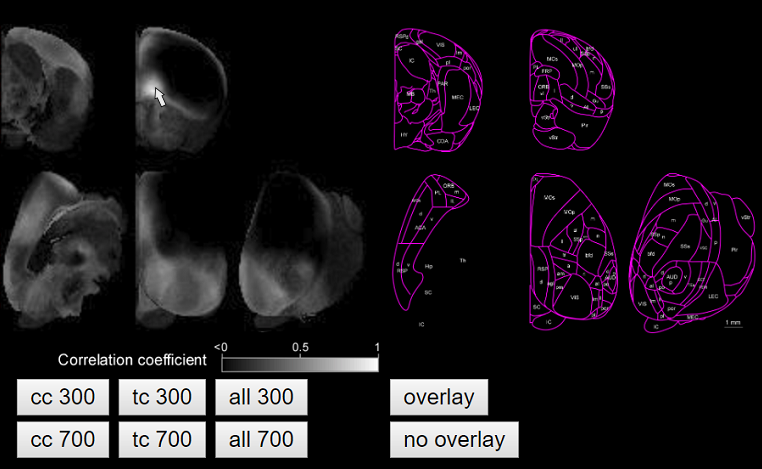
The Surface mode has sub-modes: a mode in which the data taken by the cortical injections was used (correlation was obtained based on the corticocortical projections, "cc"),
a mode in which the data taken by the thalamic injections was used (correlation was obtained based on the thalamocortical projections "tc"),
and a mode using all data ("all"). In addition, the receiver regions were either 300 um or 700 um from the cortical surface, which roughly corresponds to L2/3 or L5-L6, respectively.
For example, in "cc 300" of the Surface mode, the correlation values between the input patterns of 300 um from the surface at the seed position and those of 300 um from the surface at all positions were visualized,
when the input sources (injection sites) were in the cerebral cortex.
The Flat mode shows the flatten brain. This is technically the same as "cc300" of the Surface mode. We referred to the paper by Harris J et al.
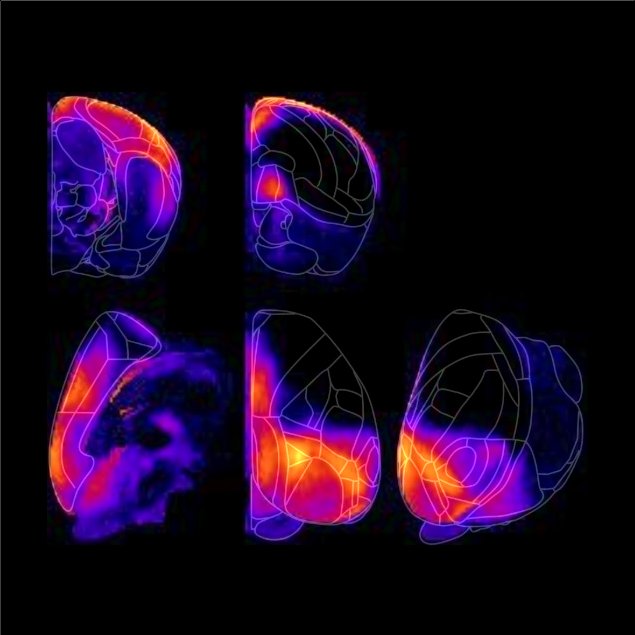
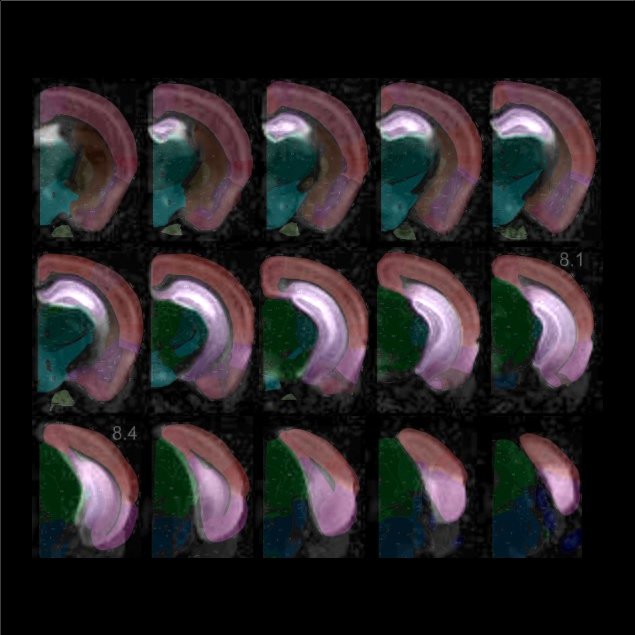
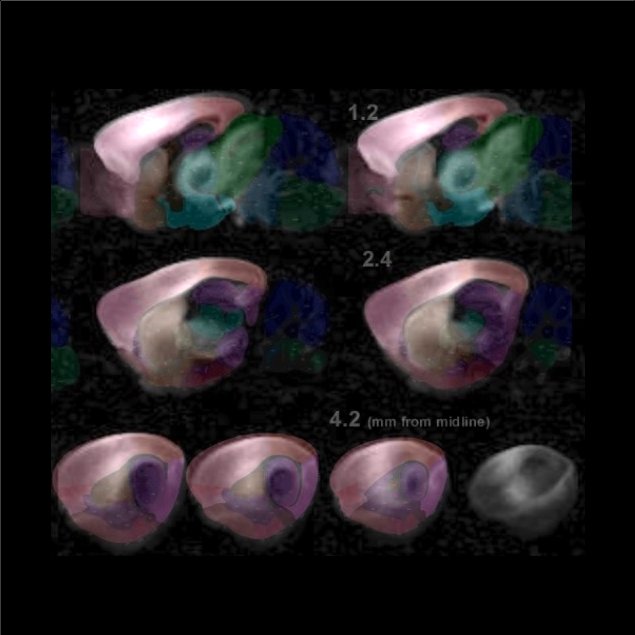
Coronal and Sagittal modes can specify any area in the brain.
Use them to visualize the connectivity of subcortical areas. For example, when the cursor is placed on the hippocampus, thalamus, striatum, superior colliculus, inferior colliculus, etc.,
you can see that the areas sharing input with those areas have laminar structures and clear boundaries. In the Coronal and the Sagittal modes, the brain was sliced in steps of 300 um and 200 um, respectively.
By overlaying with the Atlas, you can pinpoint the position of the seed position on the reference.
However, please note that the Atlas does not necessarily reflect the exact location.
Also, if you want to know the anatomy more precisely, click the link to jump to Allen Reference Atlas.
Marmoset Flat mode is the same as Flat mode of the mice, but we used anterograde tracer. See Marmoset section below for details.
Analysis
We used the Allen Mouse Brain Connectivity Atlas (Oh et al. 2014) to investigate the structure of the anatomical shared input. In this database, precise connection patterns from the injection sites (AAV1-EGFP as an anterograde tracer) to any brain region are available. For seed correlation analysis, we downloaded the data whose injection sites were either in the isocortex (1210 experiments), in the thalamus (246 experiments) or in all regions (2995 experiments) at 100 um resolution using the python code given by Allen Institute. We set a 100 um-space grid including an entire brain. Then, a set of injection sites that projected to each grid were identified. Here, the projection density of more than 0.01 was regarded as a connection. Thus, each grid has a set of injection sites where the grid receives the projections. Using these binary connectivity matrixes, we calculated the correlation coefficient between the seed grid and the other grids, and visualize the correlation values as a map for each grid. Grids that did not receive any input was excluded. Since we hardly found a large negative correlation, we ignored the negative correlation coefficient for visualization. The user can see the correlation map by specifying any seed point by moving the cursor. In the Surface modes, we showed 5 different viewing angles to cover most of the cortical surface, and two different depth (targetting L2/3 and L5-L6, 300 and 700 um from the surface of the brain, respectively) for each projection types.
Limitations
Although this tool is based on a large amount of experimental data carefully conducted by the Allen Institute, the injection positions are not evenly distributed and the data include various cell-type specific projections by using the transgenic mice. Data from experiments with a large volume of tracer spreading around injection sites can result in overestimation of the correlation coefficient. In addition, we can find a tracer backflow during injection in some experiments. Therefore, to determine whether the findings obtained by this tool reflect a true anatomical connection pattern, one should refer to the results of the original experiments. Although this tool is useful to find patterns in many cortical and subcortical areas, we hardly find useful information in the cerebellum. We sometimes notice the delay in loading the image, probably because of the poor coding of javascript. Please wait for a second or reload the entire page when it stops working. Finally, this tool may not be useful on smartphones or tablets. The environment that the developer uses is the google chrome running on the windows 10.
Marmoset
We also used database of a common marmoset, a New world monkey to visualize the connectivity on a flat map. In this case, 143 experiments were conducted with the retrograde tracers instead of the anterograde tracer used for mice. So, please be careful when interpreting the results. In this case, the large correlation implies that the regiron and the seed region has common output, but not input.
The following figure shows the brain areas where the corticocortical projection pattern resembles that of the A11 (orbitofrontal cortex) in marmosets.
References
Julie A. Harris, Stefan Mihalas, Karla E. Hirokawa, Jennifer D. Whitesell, Joseph E. Knox, Amy Bernard, Phillip Bohn, Shiella Caldejon, Linzy Casal, Andrew Cho, David Feng, Nathalie Gaudreault, Charles R. Gerfen, Nile Graddis, Peter A. Groblewski, Alex Henry, Anh Ho, Robert Howard, Leonard Kuan, Jerome Lecoq, Jennifer Luviano, Stephen McConoghy, Marty T. Mortrud, Maitham Naeemi, Lydia Ng, Seung W. Oh, Benjamin Ouellette, Staci A. Sorensen, Wayne Wakeman, Quanxin Wang, Ali Williford, John W. Phillips, Allan Jones, Christof Koch, Hongkui Zeng (2018). The organization of intracortical connections by layer and cell class in the mouse brain. BioRxiv : 292961.
Majka, P., Chaplin, T. A., Yu, H.-H., Tolpygo, A., Mitra, P. P., Wójcik, D. K., & Rosa, M. G. P. (2016). Towards a comprehensive atlas of cortical connections in a primate brain: Mapping tracer injection studies of the common marmoset into a reference digital template. Journal of Comparative Neurology, 524(11), 2161–2181.
Seung Wook Oh, Julie A. Harris, Lydia Ng, Brent Winslow, Nicholas Cain, Stefan Mihalas, Quanxin Wang, Chris Lau, Leonard Kuan, Alex M. Henry, Marty T. Mortrud, Benjamin Ouellette, Thuc Nghi Nguyen, Staci A. Sorensen, Clifford R. Slaughterbeck, Wayne Wakeman, Yang Li, David Feng, Anh Ho, Eric Nicholas, Karla E. Hirokawa, Phillip Bohn, Kevin M. Joines, Hanchuan Peng, Michael J. Hawrylycz, John W. Phillips, John G. Hohmann, Paul Wohnoutka, Charles R. Gerfen, Christof Koch, Amy Bernard, Chinh Dang, Allan R. Jones & Hongkui Zeng (2014). A mesoscale connectome of the mouse brain. Nature, 508(7495), 207.
Contact
This simple software was written by Riichiro Hira, supported by his son, Anji, and supervised by Spencer Smith at UCSB. We know that this is not perfect. Please give us comments on this interface by sending an email (riichirohira@gmail.com) or a DM on twitter, if you notice anything. We hope that many people use this tool to effortlessly get an intuitive understanding of the brain architectures. We thank people who made the Allen Mouse Brain Connectivity Atlas for the large-scale database. We also thank the Marcello Rosa's lab at the Monash University and the Laboratory of Neuroinformatics at the Nencki Institute of Experimental Biology for the database of marmosets. Finally, we would like to acknowledge the support of the NSF NeuroNex grant 1707287 and the National Institutes of Health (R01NS091335 and R01EY024294).